ThreeWill Operational Scorecard — rebrand, guided setup, yearly cadence
· 2 min read

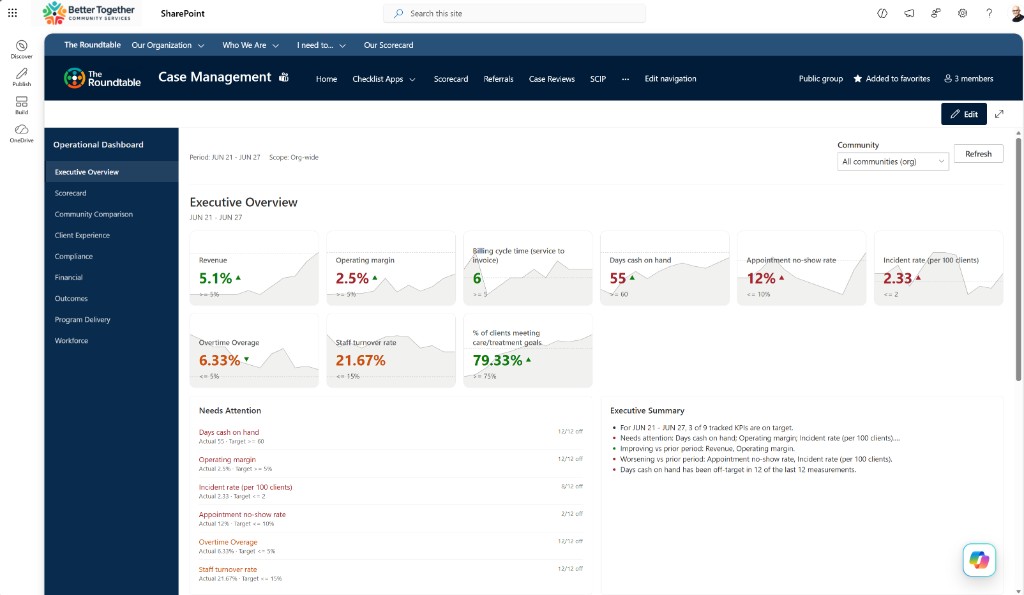
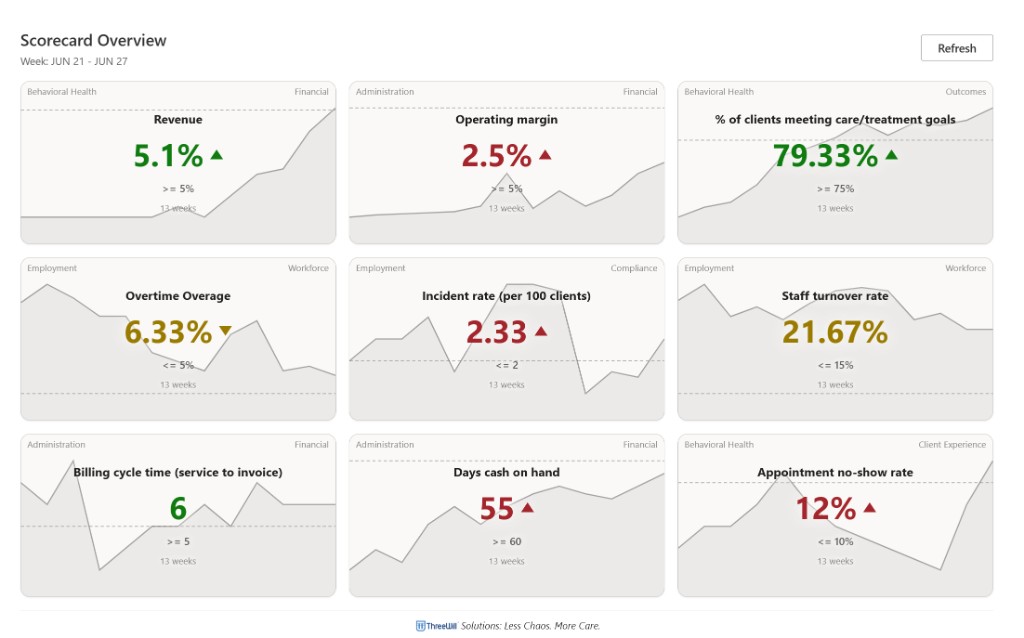
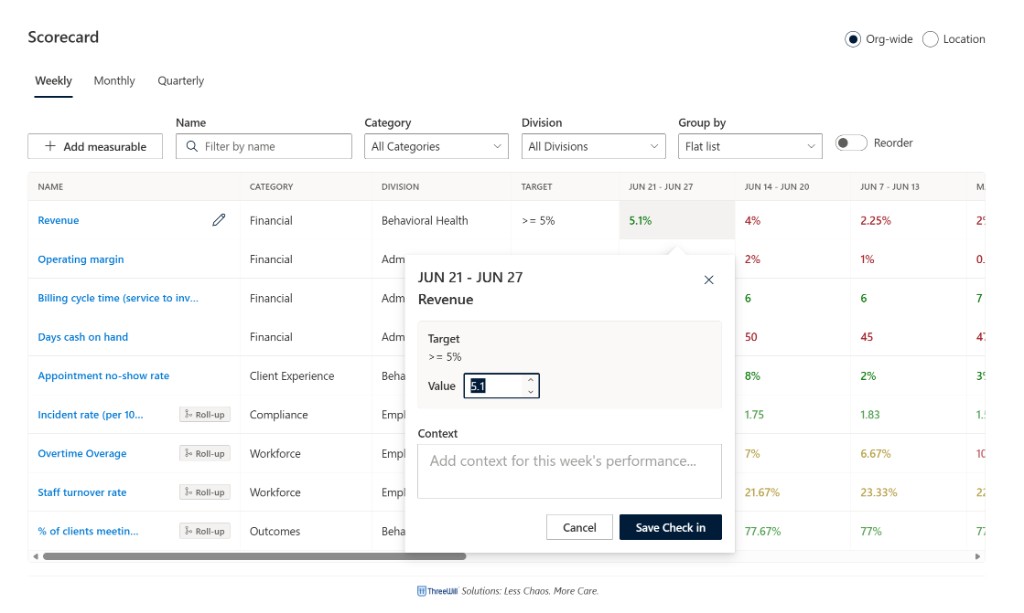
Last week the Human Services Scorecard got a full Operational Dashboard shell. This week I leaned into product identity and install experience: a clearer ThreeWill Operational Scorecard brand, a themed guided-setup wizard, and a shipped Yearly period option so annual metrics stop pretending they are months.
What happened
- Rebranded the shelf product to ThreeWill Operational Scorecard across web parts and setup surfaces
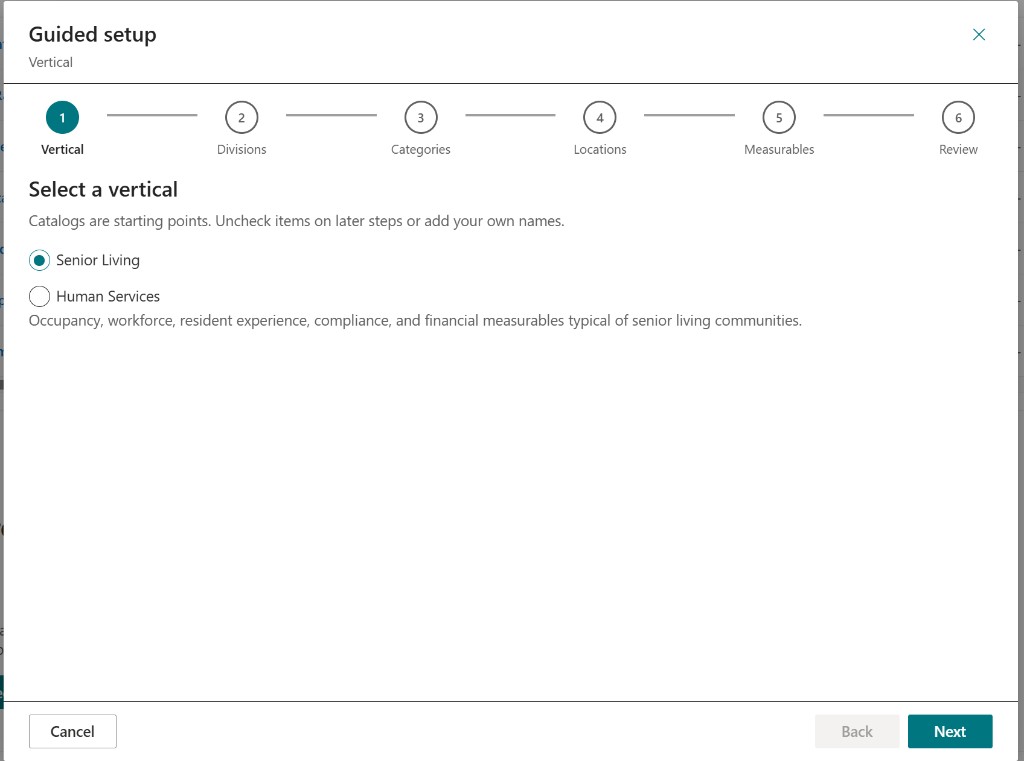
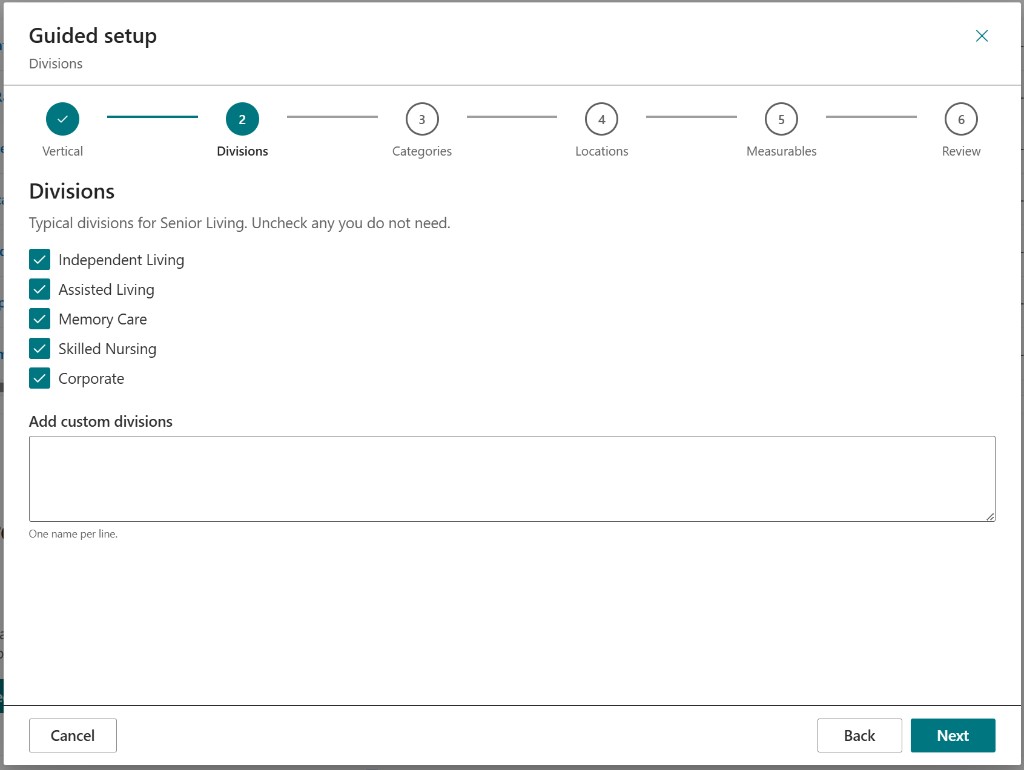
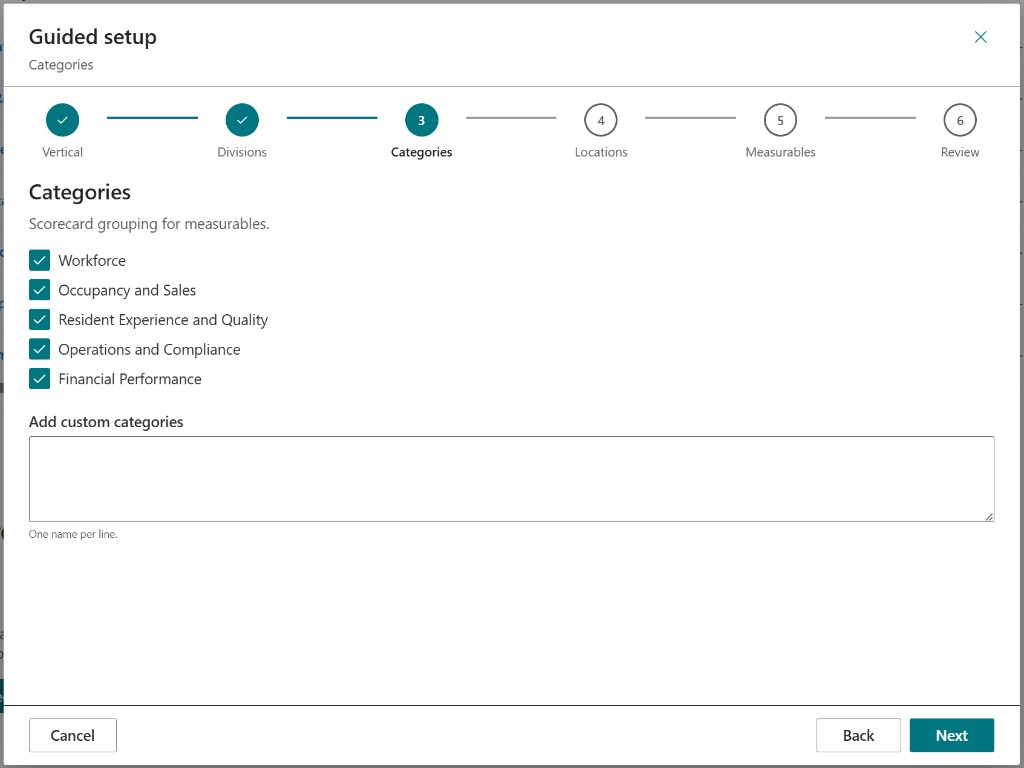
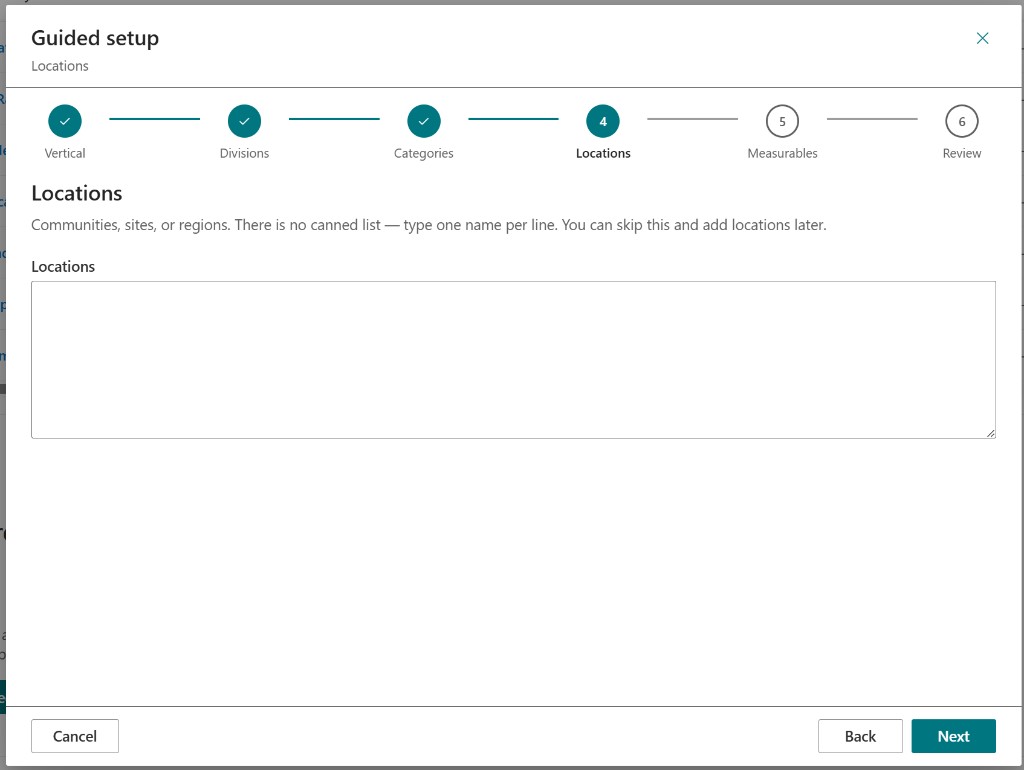
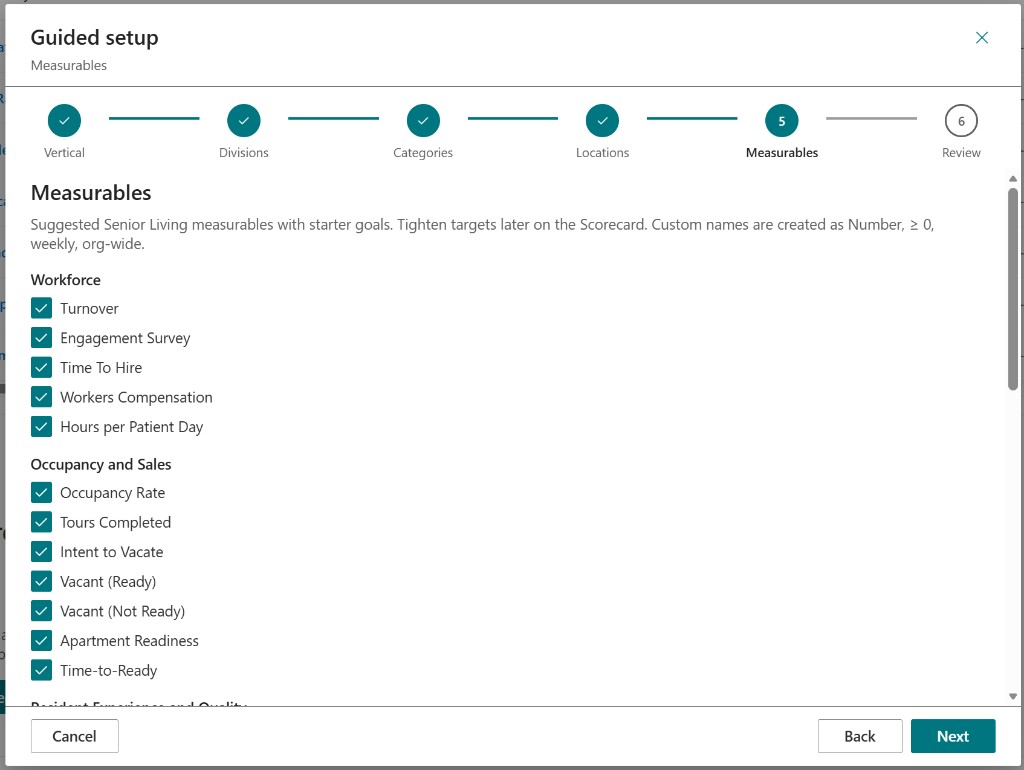
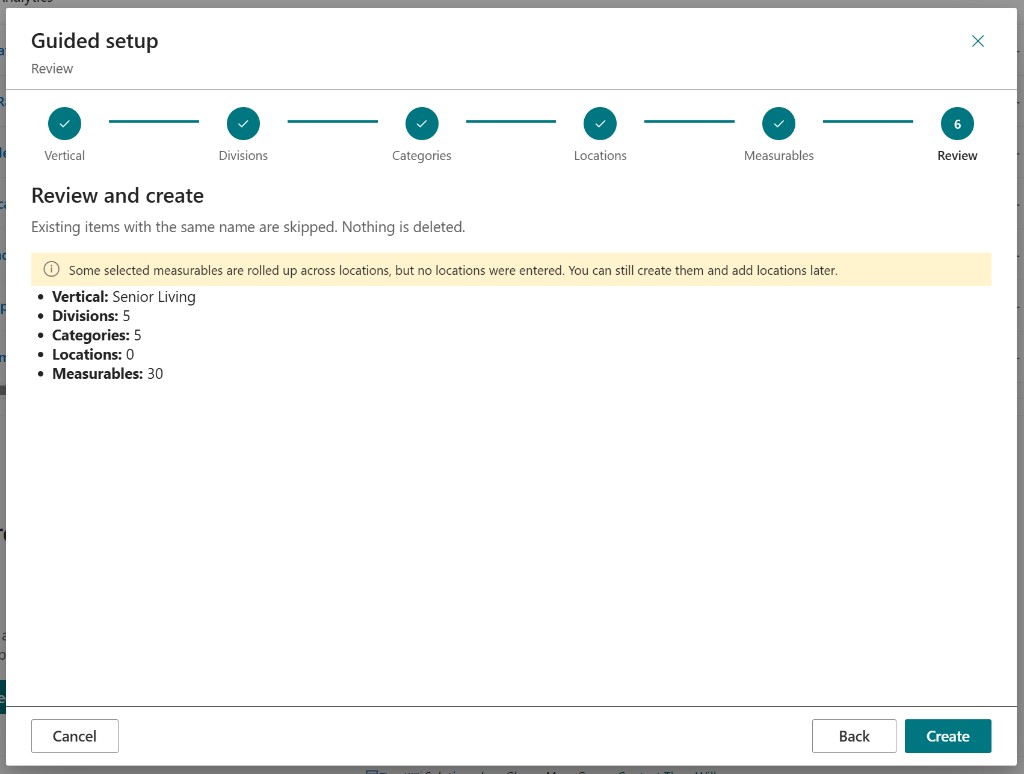
- Shipped a themed guided-setup wizard so new installs walk Vertical → Divisions → Categories → Locations → Measurables → Review instead of hunting property panes
- Vertical catalogs (Senior Living and Human Services) are starting points — uncheck later steps or add your own names
- Introduced a Yearly cadence with a configurable year-start month and day in period services and property-pane options (ready to advertise as shipped)
- Extended seed/schema and upgrade scripts so yearly fields land cleanly on existing SharePoint lists
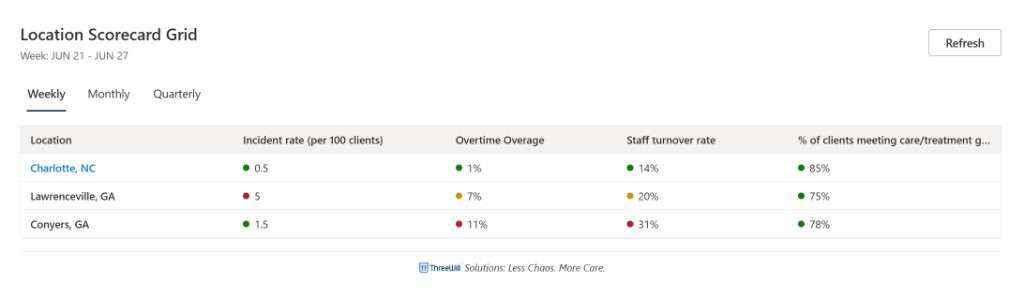
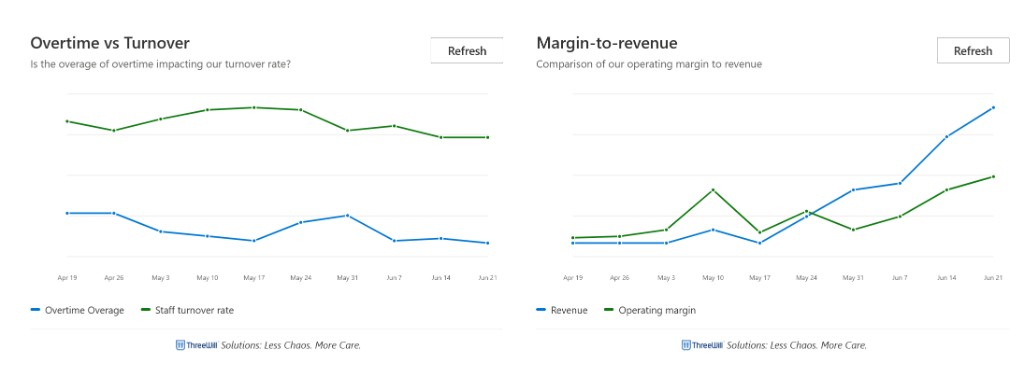
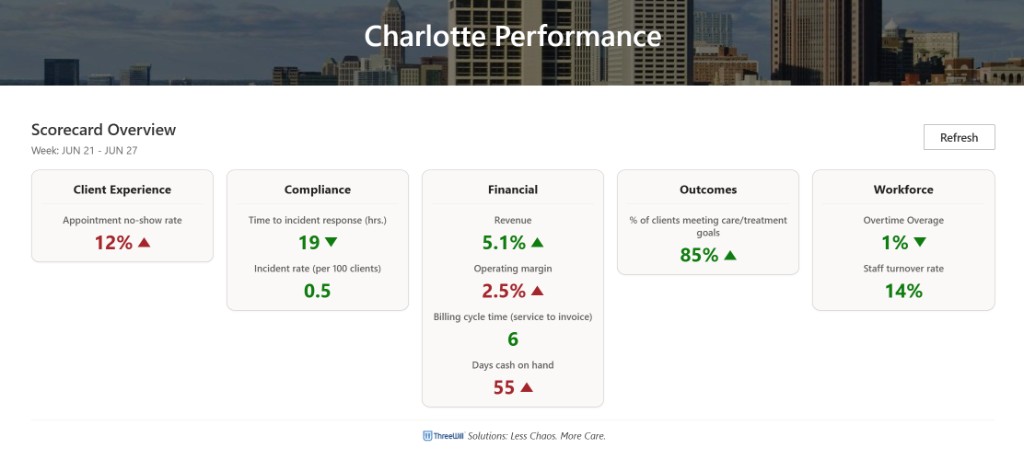
- Kept the Operational Dashboard / Attention / Summary path from last week as the display spine — this week was brand + setup + calendar math